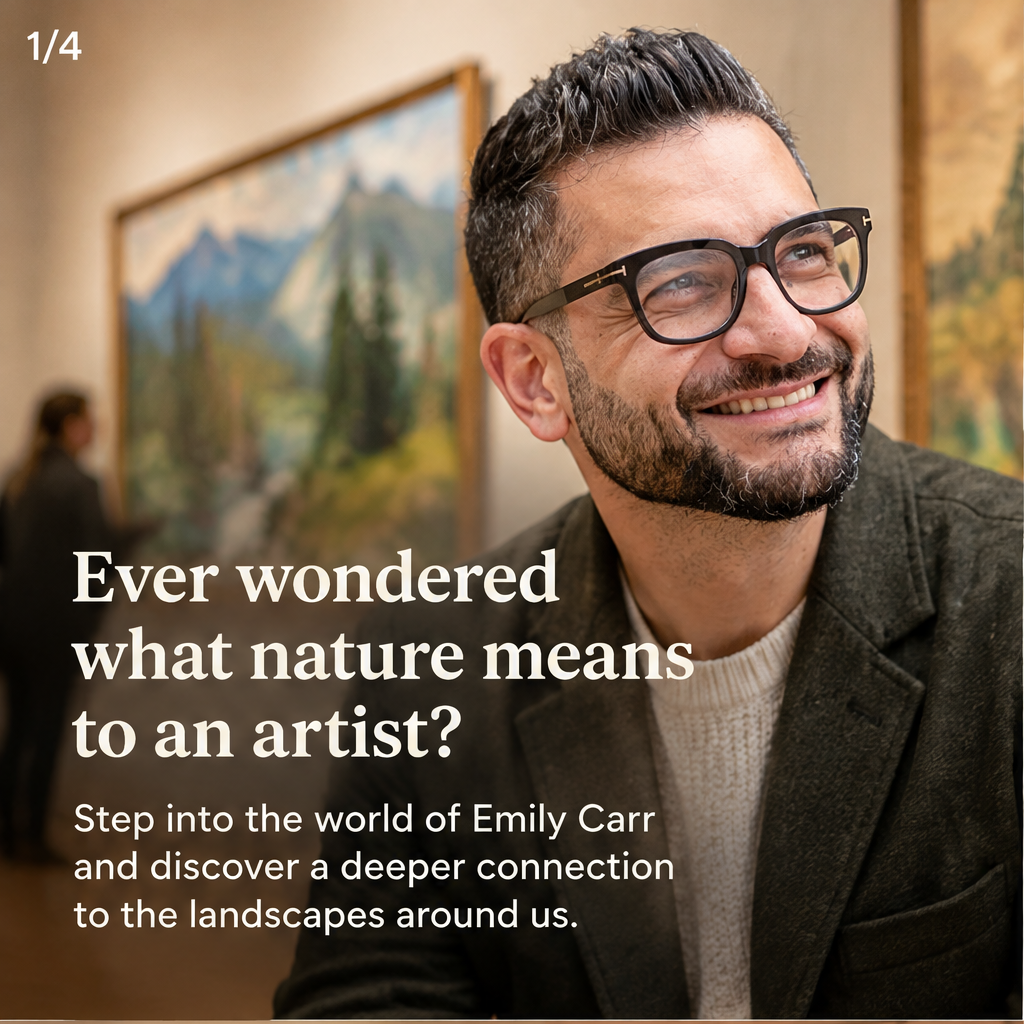
Vancouver is home to a remarkable cultural experience this year: “That Green Ideal: Emily Carr and the Idea of Nature” opens February 6, 2026, at the Vancouver Art Gallery. Running through November 8, 2026, the exhibition presents more than 100 works and marks the gallery’s largest Emily Carr exhibition in over 20 years.
The exhibition examines Carr’s deep relationship with British Columbia’s landscape, from towering forests and rugged coastlines to the emotional and spiritual ideas she connected with nature. For locals and visitors alike, it offers a chance to see familiar West Coast environments through the eyes of one of the region’s most influential artists.
Make a day of it by visiting the gallery, exploring downtown Vancouver, and reflecting on the natural spaces that make this community special. For those considering a move, Vancouver’s cultural institutions, neighbourhood character, and access to nature are all part of what makes life here so distinctive.
Save the date, invite a friend, and learn more about tickets, hours, and exhibition details at https://www.vanartgallery.bc.ca/exhibitions/that-green-ideal/. Which Vancouver landscape inspires you most?